Peak electricity hours are the periods when electricity demand is highest, and for some households, when electricity costs the most. They often fall in the late afternoon and evening, when people come home, cook, turn on appliances, and adjust heating or air conditioning. But there is no universal set of peak hours.
As electricity costs continue to put pressure on household budgets, knowing when you use electricity can become almost as relevant as knowing how much you use. The pattern also changes with the season, location, weather, and the way electricity is priced. In the U.S., for example, electricity demand is typically at its lowest in the early morning, while summer demand has historically reached its highest point around 5–6 p.m., largely because of air conditioning. Winter demand follows a different pattern, often with stronger morning and evening peaks.
Europe is more varied again. Electricity demand can look quite different from one region to another, and the hours when demand is highest don't necessarily match the hours when households pay the most.
That's an important distinction. Peak demand, peak prices, and the cheapest time to use electricity are three related but different things.
So is electricity really cheaper at night? When should you run the washing machine or dishwasher? And does shifting your electricity use actually make a noticeable difference to your bill?
Here's what the data tells us.
Peak electricity hours are the periods when electricity demand on a power grid is at its highest. They usually occur when large numbers of homes and businesses are using electricity at the same time — often because of heating or air conditioning, lighting, cooking, appliances and commercial activity.
The important point is that peak hours are not the same everywhere. The timing depends on the region, season, weather, local electricity market and even the type of customers connected to the grid.
In summer, for example, demand often builds through the afternoon as temperatures rise and air conditioners run harder. In many U.S. regions, a common high-demand window falls in the late afternoon and early evening, around 5–6 PM, although the actual system peak can occur earlier or later.
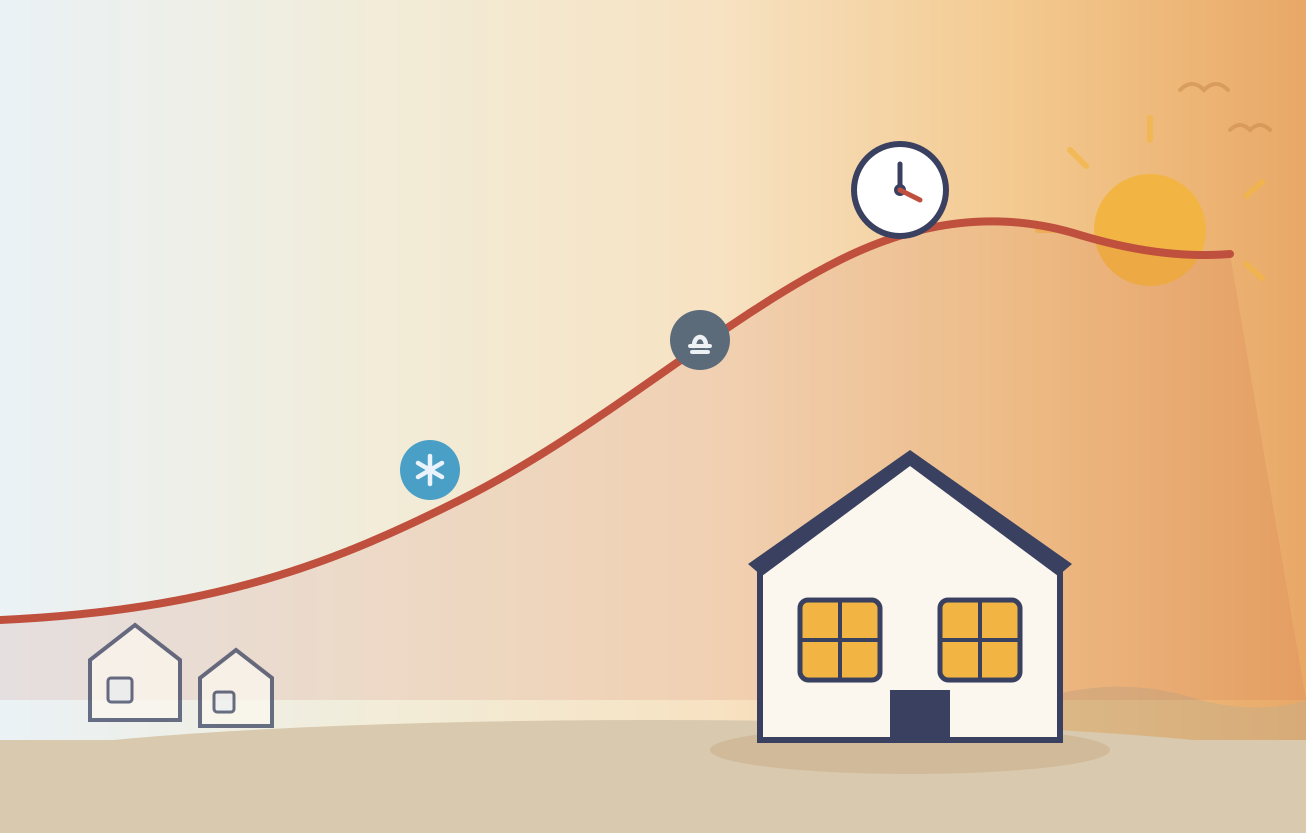
Electricity demand changes continuously throughout the day. A simplified summer day might look something like this:
This is a useful way to understand why the electricity used at 2 PM can have a different value to the grid than the electricity used at 2 AM, even if both periods consume exactly 1 kWh.
Peak demand puts more pressure on the electricity system because the grid has to supply enough generation and network capacity to meet the highest level of demand.
For households, peak hours can matter for another reason: some electricity tariffs charge more during these periods. Time-of-use plans deliberately shift the price of electricity according to the time of day, encouraging customers to move flexible consumption away from periods of high demand.
That means running a dishwasher, charging an electric vehicle or using other flexible appliances outside the peak window can sometimes reduce the cost of electricity — but only if the customer's tariff actually uses time-based pricing.
There is also an important distinction between peak electricity hours and the hours when electricity is most expensive. They are related, but they are not necessarily identical. A utility may set its pricing periods differently from the precise moment when the physical grid reaches its highest demand.
There is no single worldwide “peak electricity hour.” The exact timing changes with the region, season, weather and the mix of homes, businesses and industries connected to the grid.
Still, a pattern appears surprisingly often: electricity demand builds through the day and reaches a high point in the afternoon or early evening.
In the United States, the pattern is particularly clear in summer. According to the U.S. Energy Information Administration, average electricity demand typically rises with temperature and reaches its maximum around 5–6 PM during the summer.
That does not mean every American household has a peak electricity period from 5–6 PM. The national figure combines many different regions and grids, each with its own demand pattern.
The reason the peak arrives later than the hottest part of the day is worth understanding.
Solar radiation is strongest around midday, but buildings, roads and other surfaces continue absorbing heat through the afternoon. Air conditioners then keep running as indoor and outdoor temperatures remain elevated.
At the same time, another source of electricity demand begins to appear: people coming home.
The result is a period when cooling demand can overlap with cooking, lighting, appliances and other residential electricity use.
Recent data shows just how significant these late-afternoon and early-evening peaks can become.
On July 28, 2025, electricity demand across the contiguous Lower 48 states reached a preliminary record of 758,053 MW between 6 and 7 PM Eastern Time. The following day, July 29, it reached another record of 759,180 MW.
The U.S. Energy Information Administration's analysis of the July 2025 records notes an important detail: the nationwide figure is a coincident peak. Individual regions and utilities can reach their own maximum demand at different times.
That difference matters.
During a June 2025 heat wave, for example, the PJM Interconnection reached 160,560 MW between 5 and 6 PM. Another region experiencing the same broad weather system could have a different peak altogether.
Summer is only one part of the story.
The daily electricity curve changes considerably between summer and winter. EIA's analysis of hourly electricity consumption shows that summer demand generally has a single, broader afternoon peak, largely driven by air conditioning. For more detail on how cooling equipment contributes to that demand, see our guide to how much electricity an air conditioner uses.
Winter demand is different. It often has both a morning and an evening peak, as people heat their homes, get ready for work and school, return home, cook and switch on lights.
These are broad patterns rather than fixed schedules. Weather can completely reshape them.
During a severe heat wave in the U.S. Northwest, for example, EIA found that electricity demand often peaked around the hour ending at 6 or 7 PM, even though temperatures themselves tended to reach their maximum earlier.
In Boise, Idaho, temperatures reached 105°F at 4 PM on June 29, 2021, while electricity demand continued climbing and reached its peak around 6 PM. The lag is a useful illustration of why electricity demand does not necessarily peak at the moment the thermometer does.
This distinction is worth keeping in mind when searching for peak electricity hours.
The physical electricity grid has a peak whenever demand reaches its highest level. Your electricity tariff may define its own peak pricing period, which can cover a broader block of time.
The U.S. Department of Energy notes that time-of-use rates commonly use defined peak, shoulder and off-peak periods, and that these periods can vary by utility and season.
So a utility might define its summer peak period as several afternoon or evening hours even though the actual grid reaches its maximum demand at only one particular hour.
In other words: 5–6 PM is a good starting point for understanding peak electricity demand, especially on hot summer days in the U.S. But the actual peak for your home may be different.
The most reliable answer comes from looking at your local grid or your electricity tariff, rather than assuming that one peak-hour schedule applies everywhere. EIA's Hourly Electric Grid Monitor, for example, provides hourly demand data for U.S. regions and balancing authorities.
There is one more distinction worth making.
The hour when electricity demand is highest is not necessarily the hour when electricity costs the most.
A physical grid peak is determined by electricity demand. A customer's electricity price, however, depends on the tariff they are actually on.
Time-of-use plans deliberately divide the day into pricing periods. As the U.S. Department of Energy explains, these plans often include an afternoon peak period, overnight off-peak hours and one or more “shoulder” periods in between.
Those pricing windows are set by the utility or electricity provider. They do not have to line up perfectly with the exact hour of maximum physical grid demand.
So, for someone trying to work out when electricity is cheapest, simply knowing that the grid tends to peak around 5–6 PM isn't enough. You need to check the specific tariff.
If you just want a useful starting point, think:
Summer → late afternoon / early evening
Winter → morning + evening
Spring & autumn → generally lower and flatter
In the U.S., 5–6 PM is a particularly useful summer benchmark, but it should never be treated as a universal rule. Weather, geography, solar generation, industry and household habits can all move the peak.
And that is ultimately what makes peak electricity hours interesting: the peak isn't really a time on the clock. It's a moving point on the demand curve.
For anyone wanting to see how that curve changes in real time, the EIA's Hourly Electric Grid Monitor provides hourly electricity-demand data for U.S. regions and balancing authorities.
If you're trying to lower your electricity bill, the cheapest time to use electricity is usually determined by your electricity tariff, not simply by when overall grid demand is lowest.
On a time-of-use plan, electricity is divided into different pricing periods. Off-peak hours are generally cheaper, while peak periods cost more. Overnight and early-morning hours are often off-peak because electricity demand is typically lower.
Overnight → usually cheaper
Morning → demand rises
Late afternoon / early evening → often more expensive
Night → demand falls again
But there is no universal cheapest hour.
Utilities set their own pricing schedules, and these can change by region, season and tariff. The U.S. Department of Energy notes that time-variable pricing programs can use different peak and off-peak periods depending on the electricity provider. U.S. Department of Energy
That means charging an electric vehicle at 2 AM might be considerably cheaper than charging it at 6 PM on one tariff, while making little or no difference on a flat-rate plan.
This is one of the easiest things to confuse.
The electricity grid might experience its highest demand around the late afternoon or early evening, but a utility could define its expensive pricing period as 4–9 PM, for example.
So there are really two questions:
The U.S. Energy Information Administration's hourly grid data shows how electricity demand changes throughout the day, with demand generally reaching lower levels overnight before increasing during the morning and daytime. EIA — Hourly Electric Grid Monitor
So if you're looking to save money, check your tariff before changing when you use electricity.
If you're also considering generating your own electricity, the cost of installing solar panels is another important part of the equation. See our guide to how much it costs to solar power a house to compare the upfront investment with potential long-term electricity savings.
Moving a dishwasher, washing machine or EV charger away from peak hours only saves money when your electricity plan actually charges different rates at different times.
The takeaway: the grid has peak hours, but your electricity bill has pricing periods. They often overlap, but they are not necessarily the same.
Electricity demand is not constant. It rises and falls as millions of homes, businesses and industrial facilities switch equipment on and off.
The pattern is particularly noticeable on hot days.
In many regions, electricity use begins climbing through the morning as people arrive at work, businesses open and household activity increases. By the afternoon, air conditioning can become a major additional load. Demand may remain high into the early evening as cooling overlaps with people returning home and starting their evening routines.
That is why the exact peak hour can move from one day to another.
Temperature is particularly important because cooling demand can rise rapidly once temperatures become uncomfortable.
The U.S. Energy Information Administration notes that electricity demand generally increases during periods of extreme temperatures, as households and businesses use more heating or air conditioning. U.S. Energy Information Administration
A mild summer day can therefore have a very different demand profile from an extremely hot one.
There is also a simple household effect.
As people return home, electricity use can increase through cooking, lighting, appliances, entertainment and increasingly electric vehicle charging.
If this happens while air conditioners are still running heavily, several sources of demand overlap.
That overlap is one reason the late afternoon and early evening can become such an important period for electricity systems.
The result is a moving target rather than a fixed daily schedule.
There is no universal peak electricity hour. A useful rule of thumb may be 5–6 PM in some circumstances, but the actual peak depends on the combination of weather, geography, season, local habits and the electricity system itself.
That is why regional electricity data is more useful than relying on a single nationwide number.
Electricity has a cost at every hour of the day, but that does not mean the price on your bill changes every hour.
At the wholesale level, the cost of supplying electricity can change continuously. Demand, fuel costs, power-plant availability, weather and constraints on the grid can all affect the cost of producing and delivering electricity. The U.S. Energy Information Administration explains the main factors affecting electricity prices
But most households do not buy electricity directly at the wholesale price.
Instead, customers pay according to a retail tariff. Some tariffs use a relatively consistent rate, while others use time-of-use pricing, where the price per kilowatt-hour depends on when electricity is consumed. EIA's definition of time-of-day pricing
Imagine two households using exactly 1 kilowatt-hour at 6 PM.
The first household has a flat-rate tariff. Its electricity rate is the same regardless of the hour, so the 6 PM usage does not carry a special peak-hour price.
The second household has a time-of-use tariff. Its rate may be higher during a defined evening peak period and lower during an off-peak period.
The electricity being used is the same. The tariff is different.
This is why peak demand and peak pricing should not be treated as the same thing.
Wholesale electricity prices can be particularly sensitive to high-demand periods because additional or more expensive generation may be needed to meet the load. Yet most retail customers do not see those hourly movements directly. EIA notes that many consumers instead pay rates based on seasonal or other retail pricing structures.
If your electricity plan does not use time-based pricing, shifting an appliance from 6 PM to 10 PM may not change the price you pay for that electricity.
If your plan does use time-based pricing, the timing can matter.
The relevant question is therefore not simply:
“Is this a peak hour?”
It is:
“Does my electricity tariff charge differently during this hour?”
That distinction becomes increasingly important as more utilities introduce time-based rates and other forms of dynamic pricing. EIA tracks customers enrolled in these programs, but it does not publish a universal set of peak and off-peak retail rates because those rates are determined by individual utilities and tariffs. EIA's explanation of utility rates and tariffs
For context, the average U.S. residential electricity price was 18.44¢ per kWh in May 2026, according to EIA. That figure is an average retail price across residential customers; it is not a universal peak-hour rate. EIA Electric Power Monthly — May 2026 electricity prices
So when looking at peak-hour electricity costs, the useful sequence is:
grid conditions → wholesale costs → retail tariff → your bill
The first two can change from hour to hour. The last two depend on how electricity is priced for the customer.
That is the part worth checking before changing when you use electricity.
Electricity is measured in the same unit almost everywhere: the kilowatt-hour.
What changes is the cost of delivering that kilowatt-hour.
Across both the U.S. and Europe, household electricity prices vary substantially between regions. In the U.S., residential customers paid an average of 18.11¢/kWh during the first five months of 2026, based on EIA's retail-sales data.
EIA: U.S. electricity prices and regional data
Europe shows a similarly wide spread. In the second half of 2025, the average household electricity price across the EU was €28.96 per 100 kWh, including taxes and levies. Ireland was at €40.42, Germany at €38.69, while Hungary was at €10.82.
Eurostat: EU household electricity prices, second half of 2025
Those differences are not simply a matter of one country producing electricity more cheaply than another.
The retail price reflects the wider system around the electricity: generation, fuel and power-plant costs, transmission and distribution networks, weather, regulation, taxes and fees. The U.S. Energy Information Administration notes that all of these factors can influence electricity prices.
EIA: factors affecting electricity prices
Generation is an important part of that mix, and the amount of electricity different sources can produce varies considerably. For a closer look at one of the most important renewable sources, see our guide to how much electricity a wind turbine produces.
This is why the price of one additional kilowatt-hour cannot be understood from the power plant alone.
A region may have relatively inexpensive generation but higher network costs. Another may face more expensive fuels or constraints on bringing electricity or natural gas into the region. Regulation can also change how those costs are ultimately passed through to customers.
Europe makes another part of the picture particularly visible: taxes and levies. Eurostat reports that these accounted for 28.9% of the average EU household electricity price in the second half of 2025.
Eurostat: electricity prices and taxes across Europe
So there is no single “electricity price.”
There are different electricity systems, different cost structures and different ways of turning those costs into a household tariff.
And that distinction becomes important when we move from regional electricity costs to peak-hour pricing.
Hot weather can change the electricity load curve quickly.
As temperatures rise, more air conditioners switch on and existing systems run for longer. In the U.S., 87% of homes use air conditioning, and summer electricity demand typically rises through the day with temperature, reaching its highest level around 5–6 p.m. U.S. Energy Information Administration — hourly electricity demand and air conditioning
That creates an important effect: cooling demand is concentrated in the same hours across many buildings. The grid therefore has to handle not just more electricity overall, but more electricity at the same time.
The effect can be substantial. The International Energy Agency estimates that cooling accounts for around 10% of global annual electricity consumption but about 30% of peak electricity demand.
This is also why the choice of heating and cooling system matters beyond the energy used at any single hour. Heat pumps can provide both heating and cooling, but whether switching makes financial sense depends on the home, the system being replaced, installation costs and electricity prices. If you're considering the switch, see our guide to whether a heat pump is worth it.
So a very hot afternoon can push the system much closer to its maximum capacity than an ordinary summer day.
Temperature doesn't just increase electricity use. It can reshape when the peak occurs.
Peak-hour electricity does not automatically mean expensive electricity. What you pay depends on your supplier and tariff. Some households pay a relatively simple rate, while others have time-of-use tariffs, where the price changes depending on when electricity is used. The U.S. Department of Energy explains how these time-variable rates work.
The basic calculation is simple: electricity used × price per kWh = cost.
Imagine a 2 kW appliance running for two hours. It uses 4 kWh, whether it runs in the afternoon or overnight. On an illustrative tariff of €0.20 per kWh off-peak and €0.35 during peak hours, those four kilowatt-hours would cost €0.80 versus €1.40.
The appliance has not used more electricity. The difference comes from when the electricity is priced.
This is why time-of-use tariffs can encourage households to move flexible activities — such as laundry, dishwashing or EV charging — away from more expensive periods. The U.S. Department of Energy notes that these tariffs can encourage customers to shift usage from higher-cost to lower-cost periods. U.S. Department of Energy — Evaluating Your Utility Rate Options
But there is no single “peak electricity price”. Prices vary substantially between markets. In the EU, the average household electricity price was €0.2896/kWh in the second half of 2025, while national prices ranged from €0.1082/kWh in Hungary to €0.4042/kWh in Ireland, according to Eurostat's latest household electricity price data. In the U.S., the average residential retail price was 17.30¢/kWh in 2025, according to the U.S. Energy Information Administration.
So the useful distinction is simple: peak demand is about when the grid is busiest; peak pricing is about when your particular tariff charges more. They can overlap, but they are not the same thing. EIA's explanation of electricity prices and peak hours
You don't always need to use less electricity. Sometimes it is enough to use it at a different time.
Some household electricity use is difficult to move. A refrigerator, essential lighting or heating and cooling often follows the needs of the household. Other loads are more flexible. The U.S. Department of Energy explains load shifting as moving electricity consumption away from higher-cost periods when the timing of the activity allows it.
An EV can charge later. A dishwasher or washing machine can often run at another time. Water heating may also have some flexibility, depending on the system. The Department of Energy's guidance on time-based electricity rates highlights these kinds of flexible loads as an opportunity to respond to different electricity prices.
But there is no universal “best” time to use electricity. The U.S. Energy Information Administration notes that time-of-use periods vary between utilities and that not every customer is on a time-varying tariff.
The useful distinction is simple: reduce what you can, shift what you can, and leave essential loads alone.
Peak hours only matter on your bill if your electricity price responds to them.
A high-demand period on the grid does not automatically mean every household is paying a higher rate. The U.S. Energy Information Administration explains that most consumers pay rates based on seasonal average costs, so they do not directly experience the hour-by-hour changes in wholesale electricity prices.
Other customers are on time-of-use or other time-variable tariffs, where prices change according to the time of day. The Department of Energy describes these rate structures as a way of encouraging customers to shift flexible electricity use toward lower-cost periods.
So the first question is surprisingly simple: what tariff are you actually on?
If your electricity rate is time-based, moving a flexible load — such as EV charging — can change what you pay. If your rate is flat, moving the dishwasher from 6 PM to 10 PM may have little or no effect on your bill. The DOE's guide to electricity rate structures separates these effects clearly: customers can reduce overall consumption, shift consumption between periods, or respond to a tariff with different prices at different times.
The grid has a peak. Your bill may or may not.
Peak hours are a useful way to understand how the electricity system works — but they are not a universal rule for your bill.
Demand changes throughout the day, and the system has to maintain enough generation and network capacity to meet those changes. But the financial effect on a household depends on its electricity tariff, location and consumption pattern.
The U.S. Energy Information Administration notes that electricity prices are shaped by factors including demand, fuel costs, generation mix, transmission and distribution. In Europe, the European Commission's electricity market information similarly reflects how different national markets and pricing structures operate.
So there is no single “peak hour” that applies everywhere.
The practical takeaway is simpler: know your tariff, understand when your electricity use is flexible, and pay attention to the periods that actually affect your rate.